WP07 - Integrative Analysis and Bioinformatics
Objectives
Multiscalar data integration in rare renal disease
EURenOmics is in the unique position to generate large-scale molecular profiles along the genotype – phenotype continuum from deeply phenotyped patient cohorts and model systems with several rare renal diseases. Defining dependencies between the molecular data sets and the comprehensive clinical profiles will allow to redefine the nosology of renal disease towards mechanism based ontologies, identify predictors of outcome and treatment response and define novel regulatory pathways for targeted intervention.
The main objectives of WP 07 are:
- Development of an integrative biomedical knowledge generation architecture of rare renal diseases
- Multilevel and hierarchical deep data analysis along the genotype-phenotype continuum
- Human disease and model data integration beyond common ontologies
Workpackage Description
To achieve the goal of a distribute multiscalar data integration of rare renal disease data sets an iterative process engaging the domain experts from WP 2-6 with the bioinformatics expertise in WP7 will be employed. The integrative biology team of WP7 has 10 years experience (EU FP 5: “Chronic progressive kidney disease.”) introducing the European renal research community to concept extraction from large scale data sets in a longstanding public-private partnership with the SME Genomatix (see references below for strategies employed).
| Databases: | Genome/transcriptome/promoter/phylogeny annotation: ElDorado |
| Transcription factors/ cofactors/ binding sites/ matrices: MatBase | |
| Literature analysis(synonyms/homonyms)/cocitations /pathways: GePS | |
| Tools: | NGS-Upstream analysis: |
| everything from mapping to SNP/CNV/peak detection, differential expression | |
| NGS-downstream analysis: | |
| Enrichment analyses/promoter analyses/genome-wide functional searches | |
| network construction/meta-analysis with other experiments/data | |
| Synopsis automatic pipeline from expression/ChIP-seq data to relevant gene | |
| network. | |
| Interfaces: | GeneIDs / expression and other values (tab delimited) |
| System provides output for other tools in the same exchange formats. | |
| Tables can be exported as tab-delimited or directly as Excel files. |
Figure 1 summarizes the data analysis and mining pipeline, which has emerged from these efforts and will be implemented in EuRenOmics. The pipeline is designed with a large degree of flexibility to allow in a WP specific manner multiple entry and exit points for large-scale data sets, integration into biological context and subsequent presentation of dependencies in intuitive graphical manner for iterative data analysis, for further details of specific pipeline elements see Table 1 and www.genomatix.de.
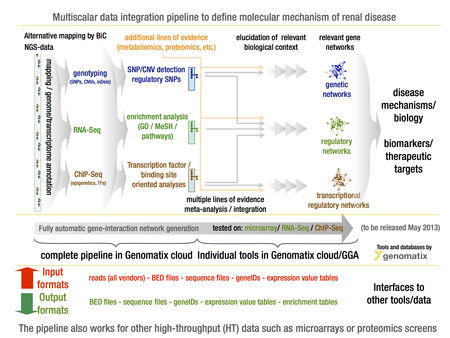
- Figure 1. GENOMATIX multi-scalar data integration workflow to define specific and shared molecular pathways in rare renal disease
In order to facilitate the optimal usage of very rich renal data sets by worldwide kidney research teams a web-based research interface for analyzing complex, disease-specific gene expression data sets using a predefined analysis algorithm has already been developed and is publically available. The Nephromine system (www.nephromine.org) is a kidney-specific search engine for context specific disease gene expression data mining (Figure 2).
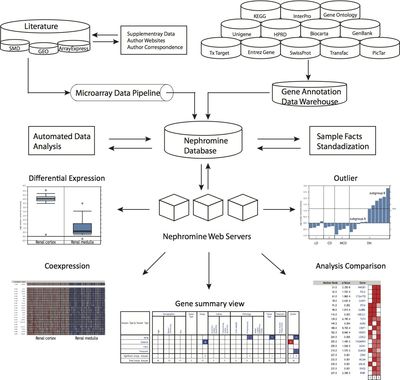
- Figure 2. Structure and capabilities of Nephromine. The database consists of three layers: data input, data analysis, and data visualization. The data input layer has two components, the gene expression data pipeline and the annotation data warehouse. The expression pipeline is used internally to identify and prioritize studies in the literature. The pipeline also draws data directly from public resources. The data-analysis layer consists of sample facts standardization and automated statistical analysis. The sample facts standardization utilizes the NCI Thesaurus and manual annotation. The automated statistical analysis component is implemented in Perl and R. A series of scripts monitor the database for new data and sample parameters and automatically performs differential expression analysis, cluster analysis, and concept analysis, when needed. The Nephromine web servers query data from the Nephromine database and display tabular and graphical representations of the data and analysis results.
WP Leader
Prof. Clemens Cohen (Deputy: Matthias Kretzler)
Ludwig-Maxmilians-Universität München


